Fun with Scratch 2.0 (Grade 4th)
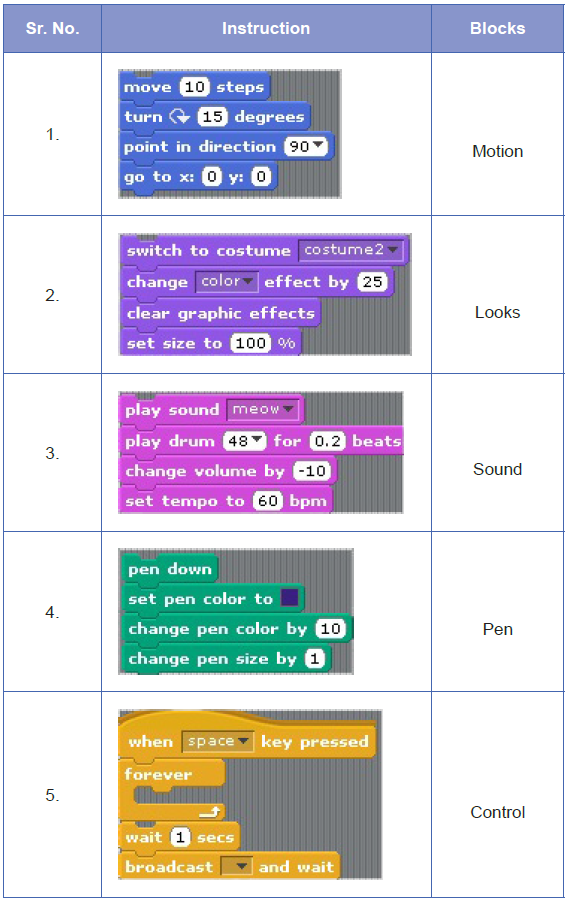
Q1. Match the following instructions with their blocks.
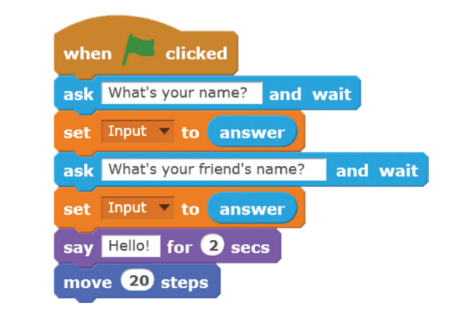
Q2.Match the command with correct action.

Extra Questions and Answers on Scratch 2.0
Q1. Enlist the components of scratch window.
Ans:
1) Sprite 2) Stage 3) New Sprite Button 4) Block Groups 5) Block Palette 6) Script 7) Tabs 8) Green Flag
1) Sprite 2) Stage 3) New Sprite Button 4) Block Groups 5) Block Palette 6) Script 7) Tabs 8) Green Flag

Q2. Who are the programmers?
Ans: The people or professionals who are specially appointed to design the
games by using programming languages are called programmers. The task
of programmer is to add images, sounds, animate the object and make the
game interactive.
Q3. What is scratch?
Ans: Scratch is a programming language. It contains script blocks that allows
the user to create interactive stories, animation and games.
Q4. Write down the steps to create new Sprite.
Ans:
Step1: Right click on the cat sprite and click on Delete.
Step2: Click the Paint New Sprite Icon to open the paint editor.
Step3: Use the drawing and painting tools to design a sprite.
Q5. Write down the steps to create costumes of a sprite.
Ans:
Step1: Once you have drawn or choosed the sprite. Click on Costume Tab and
rename your costume
Step2: Right click on the costume and select duplicate. It will create a copy of
costume.
Step3: Click on Edit Costume, the paint editor window will appear.
Step4: Make changes in the created costume as per your choice and give
another name to this costume .
Q6. Write down the steps to add music to the sprite.
Ans:
Step1: Select the sprite with different costumes.
Step2: Click on the script block
Step3: Click on the Sound group
Step4: Drag Play Sound Pop Block and drop it under 'Next Costume' Block
Q7. How can we position our sprite on stage?
Ans: The stage is divided in four squares by a horizontal and vertical lines.
These squares are called Quadrants. The horizontal line is labeled as X-axis
and vertical line is labeled as Y-axis. The point where X axis and Y axis meet
is called Origin where the value of X and Y will always be zero.
Q8 Write down the maximum values of all four Quadrants.
Ans:
Quadrant 1 : x = 240 and y=180
Quadrant 2 : x = -240 and y=180
Quadrant 3 : x = -240 and y = -180
Quadrant 4 : x = 240 and y = -180
Q9. Write down the short note on the following:
Stamp Tool: The stamp tool is used to makes the duplicate copy of the sprite by
on the sprite.
Ellipse Tool: The Ellipse tool is used to draw any circular or elliptical or oval
shape.
Eyedropper Tool: The Eyedropper tool is used to select color from anywhere by
clicking on it and will make it your selected color.
Selection Tool: The Selection tool is used to select a specific region of your
sprite or picture.